
Audio Engineering Society 120th Convention
May 20-23, 2006
Paris, France
Alexey Lukin and Jeremy Todd presented a paper on multiresolution processing techniques at the 120th AES Convention in Paris, France. The techniques described are applicable to many processing algorithms in the audio industry. Here we present the paper's abstract, followed by some examples of an improved spectrogram display along with a demo application for download. To purchase copies of the paper itself, please see the AES website.
The basic idea behind the paper is that the fixed time-frequency resolution of traditional filter banks is not optimal for many applications. For example, when analyzing audio with an STFT-based spectrogram display, many details are obscured by the limitations of the fixed time-frequency resolution. Let's consider a song containing a mix of drums, vocals, guitar, cello and a bass. An STFT-based spectrogram of a two-second segment of such a song is shown in Figure 1 below. You can also download the WAV file we used for analysis.
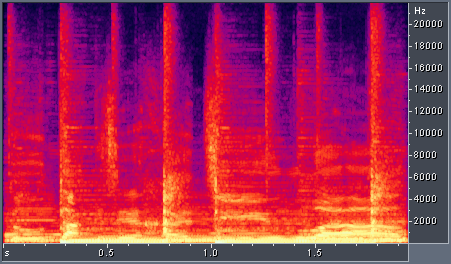
Figure 1. Rock song with STFT-based spectrogram, linear frequency scale, 12 ms window.
One problem with the above spectrogram is with the linear frequency scale. A great deal of perceptually meaningful information is in the frequency band below 4 kHz, yet this band occupies only a small portion of the display. The natural solution is to alter the frequency scale. One common choice is the mel-scale which is approximately linear below 500 Hz and logarithmic above it. The results are shown below in Figure 2.
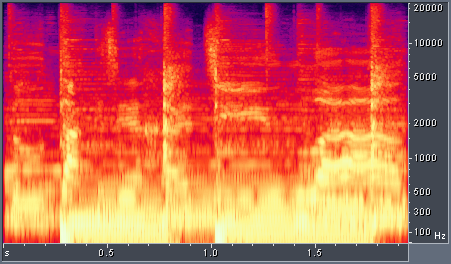
Figure 2. Rock song with STFT-based spectrogram, mel frequency scale, 12 ms window.
Now more of the frequencies below 4 kHz are visible, but there is blurring in frequency along the y-axis. This blurring prevents us from distinguishing separate instruments in the spectrogram, for example the harmonics from the bass guitar and the bass drum. We can increase the window size from 12 ms to 93 ms to reduce this blurring, as shown in Figure 3.
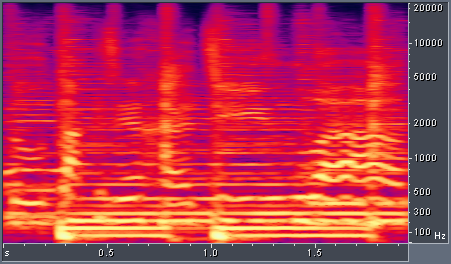
Figure 3. Rock song with STFT-based spectrogram, mel frequency scale, 93 ms window.
The bass harmonics are clearly visible in the above spectrogram, but the tradeoff between time and frequency resolution has led to blurring in time. Now transient events such as drum hits are not as crisp as they were in Figure 2. With traditional spectrograms, blurring in time and frequency could only be traded against one another. The techniques described in our paper offer further options for trading time and frequency resolution. One simple solution is to combine spectrograms with different resolutions. We can take low frequencies from the spectrogram with good frequency resolution and high frequencies from the spectrogram with good time resolution. The result is shown below in Figure 4.
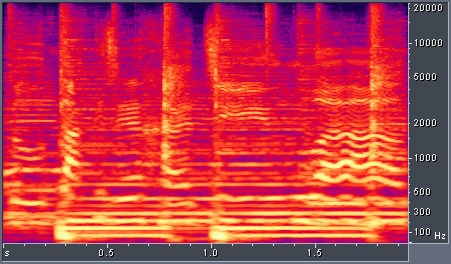
Figure 4. Rock song with multiresolution spectrogram, mel frequency scale, combination of four window sizes from 12-93 ms.
The above spectrogram shows good separation of bass harmonics and crisp transients at high frequencies, but it is not optimal. A better approach is to select the best STFT resolution locally for each time-frequency neighborhood in the spectrogram. To do this, we divide the spectrogram into a time-frequency grid, and we apply a metric to each square of the grid. One metric we apply in the paper favors better frequency resolution in the bass, based on known psychoacoustical properties of human hearing. It also attempts to maximize energy compaction in order to minimize smearing in both time and frequency. The result is an adaptive resolution spectrogram, shown in Figure 5.
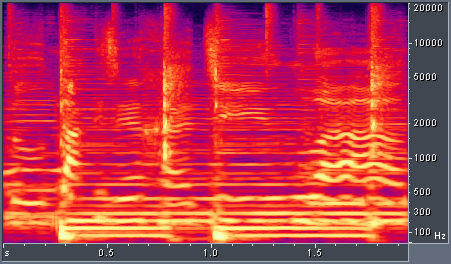
Figure 5. Rock song with adaptive resolution spectrogram, mel frequency scale.
In comparing Figures 4 and 5 there are several improvements which can be seen. For example the vertical bars representing drum hits at 0.8 and 1.8 seconds, between 1 kHz and 10 kHz, are sharper in the adaptive resolution spectrogram. The guitar harmonics at 0.4 and 1.3 seconds and above 4 kHz are more pronounced. Note that in the multiresolution spectrogram at 0.3 and 1.0 seconds and around 100 Hz, the bass drum hits are spread backwards in time. This is due to the long analysis window which captures energy from the drum hit before the center of the window reaches the drum hit itself. In the adaptive resolution spectrogram, a shorter analysis window was chosen for the region of the time-frequency plane, so the spreading is not present.
Additional Examples
For additional examples of our adaptive resolution spectrogram, view the slideshow comparison.
Abstract
Here is the abstract from the paper we presented at the AES 120th Convention:
Filter banks with fixed time-frequency resolution, such as the Short-Time Fourier Transform (STFT), are a common tool for many audio analysis and processing applications allowing effective implementation via the Fast Fourier Transform (FFT). The fixed time-frequency resolution of the STFT can lead to the undesirable smearing of events in both time and frequency. In this paper, we suggest adaptively varying STFT time-frequency resolution in order to reduce filter bank-specific artifacts while retaining adequate frequency resolution. Several strategies for systematic adaptation of time-frequency resolution are proposed. The introduced approach is demonstrated as applied to spectrogram displays, noise reduction, and spectral effects processing.
PowerPoint Presentation
You can download a PowerPoint presentation given at AES here.
Download PowerPoint Slide Show for Windows
LukinTodd_AES120.pps (857 KB)
Note that the slide show is currently available for Windows only, please contact support@izotope.com to request a version for Mac OS X.
Demo Application
We have prepared a simple demo application showing our adaptive resolution spectrogram. You can open an audio file and display traditional, multiresolution, and adaptive resolution spectrograms.
Download Spectrogram Demo application for Windows
iZotope_Spectrogram_Demo.zip (500 KB)
Note that the spectrogram demo application is currently available for Windows only, please contact support@izotope.com to request a version for Mac OS X.